


| Characteristic | Share of online traffic |
|---|---|
| - | - |
| - | - |
| - | - |
| - | - |
| - | - |
| - | - |
| - | - |
The chart is not accessible to screen readers. Please switch to the table view to access the data.
Download
Source
Sources
Release date
May 2021
More information
Region
Russia
Survey time period
2020
Supplementary notes
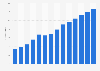
Statistics based on data from 32 stores of goods for children, included in the top 1,000 of Russian online retailers by the number of orders in 2020. The figures did not take into account the share of each website in total visits in the segment.
The study included stores specializing in the sale of goods for children, including children's clothing and shoes and toys excluding sales of children's goods by universal e-stores.
Citation formats



