| Characteristic | Share of respondents |
|---|---|
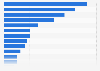
| Eat Japanese food | 99% |
| Theme parks | 84.2% |
| Bathe in a hot spring | 74.3% |
| Shopping | 65.7% |
| Nature/scenery sightseeing | 51.6% |
| Drink Japanese alcoholic beverages | 25.9% |
| Galleries/museums | 20.2% |
| Walking in shopping districts | 19.7% |
| Stay in a Japanese-style inn | 15.5% |
| Spectator sport (sumo, soccer etc.) | 15.4% |
| Ski/snowboard | 14.2% |
| Other sports (golf etc.) | 13.5% |
| Nature tours / experience in farming/mountain/fishing village | 7.2% |
| Stage or music performances | 6.5% |
| Experience Japanese history/culture | 3% |
| Enjoy Japanese pop culture (fashions, animations, etc.) | 2.4% |
| Seasons (cherry blossoms, autumn leaves, winter etc.) | 2.3% |
| Visiting film/anime settings | 0.9% |
| Experience Japanese everyday life | 0.2% |
| Medical treatment/medical check-up | 0.2% |
| None of the above | 0% |
The chart is not accessible to screen readers. Please switch to the table view to access the data.
Loading statistic...
Download
Source
Sources
Release date
March 2025
More information
Region
Japan
Survey time period
2024
Number of respondents
3,186 respondents
Special properties
multiple answers possible
Method of interview
Face-to-face interview
Supplementary notes
The annual data is compiled from the monthly surveys conducted by the Japan Tourism Agency and its contractor.
Citation formats