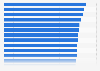
| Characteristic | 2019 | 2020 | 2021 |
|---|---|---|---|
| - | - | - | - |
| - | - | - | - |
| - | - | - | - |
| - | - | - | - |
The chart is not accessible to screen readers. Please switch to the table view to access the data.
Download
Source
Source
Release date
February 2022
More information
Region
United States
Survey time period
2019 to 2021
Supplementary notes
* Includes the proportionate share of output where Generation has an undivided ownership interest in jointly-owned generating plants and includes the total output of plants that are fully consolidated (e.g., CENG).
** Primarily natural gas and oil.
*** Includes wind, hydroelectric, solar and biomass generating assets.
Figures have been rounded.
Citation formats