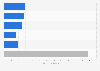
| Characteristic | Total number of consultations |
|---|---|
| - | - |
| - | - |
| - | - |
| - | - |
| - | - |
| - | - |
| - | - |
| - | - |
| - | - |
| - | - |
The chart is not accessible to screen readers. Please switch to the table view to access the data.
Download
Source
Sources
Release date
July 2020
More information
Region
Japan
Survey time period
2010 to 2019
Supplementary notes
The data given here was gathered via PIO-NET, an online network connecting the National Consumer Affairs Center of Japan (NCAC) with local consumer centers throughout Japan.
Citation formats