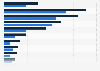
| Characteristic | 1995 | 2030* |
|---|---|---|
| - | - | - |
| - | - | - |
| - | - | - |
| - | - | - |
| - | - | - |
The chart is not accessible to screen readers. Please switch to the table view to access the data.
Download
Source
Source
Release date
July 2019
More information
Region
United States
Survey time period
1995
Supplementary notes
* Forecast.
Figures show the percentage of working hours lost to heat stress (and the associated health, well-being and productivity effects) in each sector and in the economy as a whole. Values are based on historical observations and on estimates obtained using the RCP2.6 climate change scenario (global temperature rise of 1.5掳C by the end of the century).
Citation formats