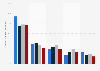
| Characteristic | Share of respondents |
|---|---|
| Not interested in driving | 26% |
| Cost of learning to drive | 13% |
| Family/friends can drive me when necessary | 12% |
| Physical difficulties/disabilities/health problems | 9% |
| Safety concerns/nervous about driving | 8% |
| Other forms of transport available | 6% |
| Too old | 5% |
| Too busy to learn | 5% |
| Cost of buying a car | 5% |
| Other reason | 4% |
| Busy/congested roads | 3% |
| Cost of insurance | 2% |
| Put off by theory/practical test | 2% |
| Other general motoring costs | 1% |
The chart is not accessible to screen readers. Please switch to the table view to access the data.
Loading statistic...
Download
Source
Source
Release date
August 2020
More information
Region
United Kingdom (England)
Survey time period
2019
Age group
17 years and older
Special properties
National Travel Survey*
Supplementary notes
* The source gives the following information: "Question asked of individuals aged 17 and over who do not hold a full or provisional driving licence and are not currently learning to drive."
Citation formats