| Characteristic | Likely | Unlikely |
|---|---|---|
| - | - | - |
| - | - | - |
The chart is not accessible to screen readers. Please switch to the table view to access the data.
Download
Source
More information
Region
Malaysia
Survey time period
November 26th to December 6th, 2019
Number of respondents
500 respondents
Age group
16-64 years
Special properties
survey sample were more urban and educated, and with higher incomes than the national average
Method of interview
Online survey
Supplementary notes
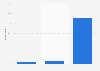
The question asked was as follows: "For each of the following, please tell me how likely or unlikely you think they are to happen...?
Average global temperatures will increase."
Citation formats