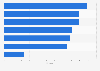
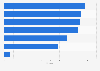
| Characteristic | Risk index score |
|---|---|
| - | - |
| - | - |
| - | - |
| - | - |
| - | - |
| - | - |
The chart is not accessible to screen readers. Please switch to the table view to access the data.
Download
Source
Source
Release date
August 2024
More information
Region
Malaysia
Survey time period
As of August 2024
Supplementary notes
According to the source, at all levels of the INFORM model, a lower value (closer to 0) always represents a lower risk and a higher value (closer to 10) always represents a higher risk. Results are rounded to one decimal place.
Citation formats