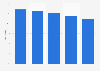
| Characteristic | Percentage of ratings that are positive |
|---|---|
| - | - |
| - | - |
| - | - |
| - | - |
| - | - |
| - | - |
| - | - |
| - | - |
| - | - |
| - | - |
The chart is not accessible to screen readers. Please switch to the table view to access the data.
October 2018
United States
as of 2018
From the source concerning methodology, " In order to help people choose the right nursing home, we鈥檝e aggregated hundreds of thousands of reviews across the web for tens of thousands of facilities. We avoid looking at average scores and instead look at the prevalence of 鈥渂ad鈥� reviews (1 or 2 star) and 鈥済ood鈥� ones (4 or 5 star). For analysis on cities, we only include ones with at least ten facilities and a hundred reviews. Moreover, while Medicare has its own star rating system, these ratings are sometimes gamed by nursing homes, so in this analysis we look solely at user-review sites."
* Positive ratings are 4 or 5 stars out of 5. Figures have been rounded.