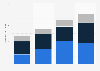
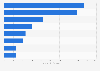
| Characteristic | Would consider investing | Would not consider investing | Not sure |
|---|---|---|---|
| - | - | - | - |
| - | - | - | - |
| - | - | - | - |
| - | - | - | - |
| - | - | - | - |
| - | - | - | - |
| - | - | - | - |
| - | - | - | - |
| - | - | - | - |
The chart is not accessible to screen readers. Please switch to the table view to access the data.
Download
Source
Source
Release date
February 2019
More information
Region
Europe
Survey time period
2018
Number of respondents
100*
Special properties
Different organizations with a total of 6.8 trillion USD of assets between them*
Method of interview
Online survey
Supplementary notes
* Based on those currently not invested (sample size of 33)
Citation formats