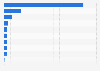
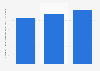
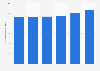
| Characteristic | Number of employees in millions |
|---|---|
| - | - |
| - | - |
| - | - |
| - | - |
| - | - |
| - | - |
| - | - |
| - | - |
| - | - |
| - | - |
The chart is not accessible to screen readers. Please switch to the table view to access the data.
Download
Source
Source
Release date
August 2025
More information
Region
Japan
Survey time period
2014 to 2023
Supplementary notes
*Including employment in accommodation services, food and beverage services, passenger transportation, travel agencies, and other reservation services, as well as other tourism-related industries.
Citation formats