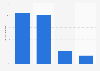
| Characteristic | Share of respondents |
|---|---|
| - | - |
| - | - |
| - | - |
| - | - |
| - | - |
| - | - |
| - | - |
| - | - |
| - | - |
| - | - |
| - | - |
| - | - |
| - | - |
| - | - |
| - | - |
| - | - |
The chart is not accessible to screen readers. Please switch to the table view to access the data.
Download
Source
Source
More information
Number of respondents
958 respondents
Age group
16 to 83 years old
Special properties
respondents who purchased food or beverages and know at least one of the named brands
Supplementary notes
Multiple answers were possible.
During the survey, the question was phrased as follows: "Below you can see a list of selected sustainable/eco-friendly brands. Which of them have you purchased products from in the last 3 months?"
Citation formats