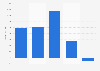
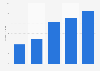
| Characteristic | Share of respondents who believe it is likely to happen |
|---|---|
| - | - |
| - | - |
| - | - |
| - | - |
The chart is not accessible to screen readers. Please switch to the table view to access the data.
Download
Source
Source
Release date
February 2019
More information
Region
Italy
Survey time period
December 21, 2018 to January 9, 2019
Number of respondents
approx. 1,000
Age group
16-64 years
Method of interview
Online panel
Supplementary notes
The source adds the following information: "Data is weighted to match the profile of the population."
Citation formats