| Characteristic | 2018 | 2019 |
|---|---|---|
| - | - | - |
| - | - | - |
| - | - | - |
| - | - | - |
| - | - | - |
| - | - | - |
| - | - | - |
| - | - | - |
| - | - | - |
| - | - | - |
| - | - | - |
| - | - | - |
| - | - | - |
| - | - | - |
| - | - | - |
The chart is not accessible to screen readers. Please switch to the table view to access the data.
Download
Source
Sources
Release date
September 2020
More information
Region
United Kingdom
Survey time period
August 31, 2018 and 2019
Supplementary notes
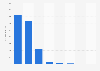
A total of 25 UK based insurance companies offering home (building and contents) insurance were looked at for claims frequency. data was aggregated.
* Year ending August 31st, 2018 and August 31st, 2019.
** Includes building and contents insurance.
Companies with the lowest claims frequency as of 2019with previous years comparison.
Citation formats