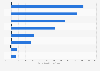
| Characteristic | Share of respondents |
|---|---|
| Health insurance | 68% |
| Paid time off* | 63% |
| Dental insurance | 59% |
| Retirement savings plan | 55% |
| Life insurance and AD&D insurance | 54% |
| Vision insurance | 52% |
| Disability insurance | 46% |
| Employee assistance programs | 42% |
| Leave of absence/ sabbatical | 34% |
| Tuition assistance or reimbursement | 33% |
| Pretax programs** | 26% |
The chart is not accessible to screen readers. Please switch to the table view to access the data.
Loading statistic...
Download
Source
Source
Release date
August 2020
More information
Region
Canada, United States
Survey time period
2020
Number of respondents
500 respondents
Special properties
HR managers.
Supplementary notes
The source doesn't mention the type of survey and age of the respondents.
Multiple responses were possible.
* Includes vacation, sick days and paid holidays.
** Includes commuter benefits, flexible spending accounts and health saving accounts.
Citation formats