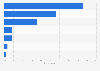
| Characteristic | Share of respondents |
|---|---|
| Metro / small bus* | 83% |
| Bus | 34% |
| Private car / motorbike | 28% |
| Walking | 27% |
| Bicycle | 12% |
| Taxi, Uber or similar | 11% |
| Other | 5% |
The chart is not accessible to screen readers. Please switch to the table view to access the data.
Loading statistic...
Download
Source
Sources
Release date
October 2017
More information
Region
Chile
Survey time period
August 31 to October 2, 2017
Number of respondents
1,000 respondents
Age group
18 years and older
Special properties
Weekdays only
Method of interview
Face-to-face interview
Supplementary notes
* The source refers to a network of buses in the Santiago area commonly known as "micros".
The survey was conducted in the Chilean cities of Antofagasta, Valpara铆so, Vi帽a del Mar, Concepci贸n, Talcahuano, and the Santiago metropolitan region (Santiago province plus San Bernardo and Puente Alto).
The original question posed on the survey was: '驴Qu茅 medio o medios de transporte utiliza habitualmente en d铆a de semana para realizar sus actividades? Favor se帽ale los dos medios m谩s frecuentes.'
Citation formats