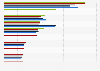
| Characteristic | Score |
|---|---|
| - | - |
| - | - |
| - | - |
| - | - |
| - | - |
| - | - |
| - | - |
| - | - |
| - | - |
| - | - |
The chart is not accessible to screen readers. Please switch to the table view to access the data.
November 2018
United States
2018
Scores are based on: 14% Licensure, as measured by the percentage of designers licensed in their respective fields, the average percentage increase in salary or bonus paid upon licensure, and how the firm mentors young designers;
7% Pro bono work, as measured by participation in Public Architecture鈥檚 1+ program, the percentage of billable hours dedicated to pro bono, and the scope of the pro bono work;
4% Design awards, including awards issued by architect and prominent institutions such as the AIA and the ASLA;
3% Research, as measured by the percentage of profits invested in it and its scope and significance and;
72% A design portfolio, scored individually by several experts and combined to create an overall score.