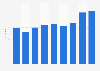
| Characteristic | Number of visitors (in millions) | Estimated gross sales (in million U.S. dollars) |
|---|---|---|
| - | - | - |
| - | - | - |
| - | - | - |
| - | - | - |
Download
Source
More information
Region
Worldwide
Survey time period
2017 to 2020*
Supplementary notes
*Figures refer to the following periods:
teamLab Borderless and teamLab Planets:
June 2018 to May 2019
Artechouse:
June 2017 to December 2020
teamLab x Pace:
2017 to 2019
Citation formats