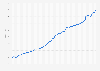
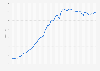
| Characteristic | Labor productivity in 2017 U.S. dollars PPP |
|---|---|
| - | - |
| - | - |
| - | - |
| - | - |
| - | - |
| - | - |
| - | - |
| - | - |
| - | - |
| - | - |
| - | - |
| - | - |
| - | - |
| - | - |
| - | - |
The chart is not accessible to screen readers. Please switch to the table view to access the data.
Download
Source
Source
Release date
November 2023
More information
Region
Taiwan
Survey time period
2010 to 2024
Supplementary notes
* According to the source, 2017 U.S. dollars PPP = converted to 2017 price level with updated PPP (Purchasing power parity)
Figures represent modelled ILO estimates based on IMF GDP data and estimates for total hours worked.
Citation formats