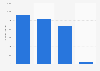
| Characteristic | Subsidies in million U.S. dollars |
|---|---|
| - | - |
| - | - |
| - | - |
| - | - |
| - | - |
| - | - |
| - | - |
The chart is not accessible to screen readers. Please switch to the table view to access the data.
Download
Source
Source
Release date
April 2018
More information
Region
United States
Survey time period
FY 2016
Supplementary notes
* In 2016 U.S. dollars. Energy-specific tax expenditures associated with renewables were allocated based on preliminary generation data. No hydropower generation was assumed to be eligible for production tax credits (PTC). It was assumed all investment tax credits were claimed by solar power plants. Municipal Solid Waste (MSW) and open-loop biomass generation estimates used.
Citation formats