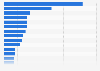
| Characteristic | Primary specialty | Secondary specialty |
|---|---|---|
| - | - | - |
| - | - | - |
| - | - | - |
| - | - | - |
| - | - | - |
| - | - | - |
| - | - | - |
| - | - | - |
| - | - | - |
| - | - | - |
| - | - | - |
| - | - | - |
| - | - | - |
| - | - | - |
| - | - | - |
The chart is not accessible to screen readers. Please switch to the table view to access the data.
Download
Source
Source
Release date
September 2016
More information
Region
North America, United States
Survey time period
2015
Number of respondents
4,143 respondents
Special properties
licensed psychologists with doctoral degrees
Method of interview
Email survey
Supplementary notes
Missing values were excluded prior to analysis. Respondents who selected the same primary and secondary area of specialty were counted in primary area of specialty only. Totals may not sum to 100 percent due to rounding.
Citation formats