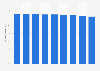
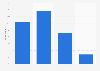
| Net worth range in Australian dollars | Number of households in thousands |
|---|---|
| Less than $0 | 127.3 |
| $0 to less than $50,000 | 1,105.2 |
| $50,000 to less than $100,000 | 599.3 |
| $100,000 to less than $150,000 | 432.2 |
| $150,000 to less than $200,000 | 348.8 |
| $200,000 to less than $250,000 | 329.8 |
| $250,000 to less than $300,000 | 291.8 |
| $300,000 to less than $350,000 | 251.9 |
| $350,000 to less than $400,000 | 294.1 |
| $400,000 to less than $450,000 | 270.3 |
| $450,000 to less than $500,000 | 258.3 |
| $500,000 to less than $600,000 | 548.3 |
| $600,000 to less than $700,000 | 449.5 |
| $700,000 to less than $800,000 | 409.7 |
| $800,000 to less than $900,000 | 348.9 |
| $900,000 to less than $1,000,000 | 323.3 |
| $1,000,000 to less than $1,100,000 | 324.3 |
| $1,100,000 to less than $1,200,000 | 282.7 |
| $1,200,000 to less than $1,400,000 | 418.1 |
| $1,400,000 to less than $1,600,000 | 315.7 |
| $1,600,000 to less than $1,800,000 | 232.5 |
| $1,800,000 to less than $2,000,000 | 198.7 |
| $2,000,000 to less than $2,200,000 | 162.7 |
| $2,200,000 to less than $2,400,000 | 132.8 |
| $2,400,000 to less than $2,600,000 | 103.9 |
| $2,600,000 to less than $3,000,000 | 136 |
| $3,000,000 to less than $4,000,000 | 233.1 |
| $4,000,000 to less than $5,000,000 | 120 |
| $5,000,000 to less than $7,000,000 | 117.8 |
| $7,000,000 to $10,000,000 | 47 |
| More than $10,000,000 | 58.6 |
The chart is not accessible to screen readers. Please switch to the table view to access the data.
Loading statistic...
Download
Source
Source
Release date
July 2019
More information
Region
Australia
Survey time period
financial year 2018
Supplementary notes
Australian dollar prices are adjusted using changes in the Consumer Price Index.
Net worth, which is often referred to as wealth, is the value of a household's assets less the value of its liabilities.
Australia's financial year runs from July 1 to June 30; for example, financial year 2017 starts on July 1, 2016 and ends on June 30, 2017.
Citation formats