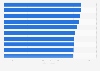
| Characteristic | Share of respondents who replied 'A more frequent service' |
|---|---|
| - | - |
| - | - |
| - | - |
The chart is not accessible to screen readers. Please switch to the table view to access the data.
Download
Source
More information
Region
Italy
Survey time period
October to December 2014
Number of respondents
3,042 respondents
Age group
14-80 years
Special properties
Respondents who would be willing to use public transport
Method of interview
Computer-assisted telephone interviews (CATI)
Citation formats