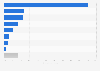
| Characteristic | 2016 | 2017 | 2018 |
|---|---|---|---|
| - | - | - | - |
| - | - | - | - |
| - | - | - | - |
| - | - | - | - |
| - | - | - | - |
| - | - | - | - |
| - | - | - | - |
| - | - | - | - |
| - | - | - | - |
| - | - | - | - |
| - | - | - | - |
| - | - | - | - |
| - | - | - | - |
| - | - | - | - |
The chart is not accessible to screen readers. Please switch to the table view to access the data.
Download
Source
Sources
Release date
September 2018
More information
Region
United States
Survey time period
2016 to 2018
Number of respondents
170 respondents
Special properties
employed at a location that uses pallets
Supplementary notes
The source does not specify the age of respondents or method of the survey.
2016 base = 286 respondents.
2017 base = 274 respondents.
Surveys took place in July each year.
Citation formats