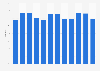
| Destination | Average hotel occupancy * |
|---|---|
| - | - |
| - | - |
| - | - |
| - | - |
| - | - |
| - | - |
| - | - |
| - | - |
| - | - |
| - | - |
The chart is not accessible to screen readers. Please switch to the table view to access the data.
Download
Source
Source
Release date
March 2017
More information
Region
Spain
Survey time period
March 28, 2017
Supplementary notes
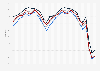
The study takes into account the searches of trivago users in the world to stay in a hotel between April 13 and 17.
* Average hotel occupancy on March 28, 2017 for the dates between April 13 and 17 of that year.
Citation formats