| Characteristic | Percentage of patients |
|---|---|
| - | - |
| - | - |
| - | - |
| - | - |
| - | - |
The chart is not accessible to screen readers. Please switch to the table view to access the data.
Download
Source
Sources
Release date
October 2019
More information
Region
North America, United States
Survey time period
September 4 to 13, 2019
Number of respondents
2,001 respondents
Age group
27 to75 years
Special properties
had seen the same doctor at least two times in the past 12 months
Method of interview
Online survey
Supplementary notes
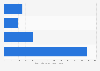
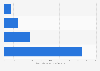
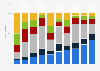
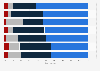
Original question: "Who do you believe makes the ultimate decision when it comes to the treatment options that are available to patients?"
Citation formats