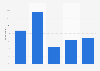
| Characteristic | Number of persons |
|---|---|
| - | - |
| - | - |
| - | - |
| - | - |
| - | - |
| - | - |
| - | - |
The chart is not accessible to screen readers. Please switch to the table view to access the data.
Download
Source
Sources
Release date
January 2016
More information
Region
Asia, Japan
Survey time period
2014 to 2020
Special properties
simulated figures
Supplementary notes
Figures for employment generated are calculated using the 2011 Input-Output tables for Japan. It is assumed that construction investment increases final demand in the construction sector, and inbound tourism increases that in the commerce and services sector.
Citation formats