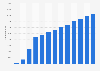
| Characteristic | Gross adjusted per capita household disposable income in U.S. dollars |
|---|---|
| - | - |
| - | - |
| - | - |
| - | - |
| - | - |
| - | - |
| - | - |
| - | - |
| - | - |
| - | - |
| - | - |
| - | - |
| - | - |
| - | - |
| - | - |
| - | - |
| - | - |
| - | - |
| - | - |
| - | - |
| - | - |
| - | - |
| - | - |
| - | - |
| - | - |
| - | - |
| - | - |
| - | - |
| - | - |
| - | - |
| - | - |
The chart is not accessible to screen readers. Please switch to the table view to access the data.
Download
Source
Source
Release date
January 2026
More information
Region
Worldwide, OECD
Survey time period
2022 to 2024
Supplementary notes
Values have been adjusted for purchasing power parity and take into account both the payment of taxes and social contributions, and transfers in kind received by households (such health or education provided for free or at reduced prices by government).
* Numbers are from 2023.
Citation formats