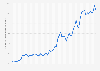
| Characteristic | Energy imports dependency rate |
|---|---|
| 2024 | 38.23% |
| 2023 | 39.71% |
| 2022 | 43.14% |
| 2021 | 32.23% |
| 2020 | 44.89% |
| 2019 | 38.88% |
| 2018 | 22.7% |
| 2017 | 11.34% |
| 2016 | 13.57% |
| 2015 | 13.08% |
| 2014 | 12.23% |
| 2013 | 12.31% |
| 2012 | -3.17% |
| 2011 | -6.31% |
| 2010 | -16.23% |
The chart is not accessible to screen readers. Please switch to the table view to access the data.
Loading statistic...
Download
Source
Source
Release date
April 2026
More information
Region
Denmark
Survey time period
2010 to 2024
Supplementary notes
The source adds the following information: "The indicator shows the share of total energy needs of a country met by imports from other countries. It is calculated from energy balances as net imports divided by the gross available energy. Energy dependence = (imports 鈥� exports) / gross available energy.
Negative value indicates net exporter: country that exports more fuels than it consumes.
Values higher than 100% mostly refer to the build of stocks (increase of fule in stocks), however might be also a result of statistical discrepancies in raw data.."
Citation formats