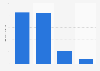
| Characteristic | Sales volume in million 9-liter cases |
|---|---|
| - | - |
| - | - |
| - | - |
| - | - |
| - | - |
| - | - |
| - | - |
| - | - |
| - | - |
| - | - |
| - | - |
| - | - |
| - | - |
| - | - |
| - | - |
| - | - |
| - | - |
| - | - |
| - | - |
| - | - |
| - | - |
| - | - |
| - | - |
The chart is not accessible to screen readers. Please switch to the table view to access the data.
Download
Source
Sources
Release date
July 2022
More information
Region
United States
Survey time period
1999 to 2021
Supplementary notes
* Wine shipments in millions of 9-liter cases from California, other states and foreign producers entering U.S. distribution.
Includes all still wines not over 14 percent alcohol, including bulk imports bottled in the U.S.
Excludes exports. Excludes cider as of 2011 going forward.
Figures prior to 2009 have been taken from previous editions of the publication.
Citation formats