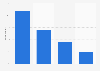
| Household income in U.S. dollars | Less than $20,000 | $20,000 to $34,999 | $35,000 to $49,999 | $50,000 to $74,999 | $75,000 to $99,999 | $100,000 to $149,999 | $150,000 or more | Prefer not to answer |
|---|---|---|---|---|---|---|---|---|
| - | - | - | - | - | - | - | - | - |
| - | - | - | - | - | - | - | - | - |
| - | - | - | - | - | - | - | - | - |
| - | - | - | - | - | - | - | - | - |
| - | - | - | - | - | - | - | - | - |
| - | - | - | - | - | - | - | - | - |
| - | - | - | - | - | - | - | - | - |
The chart is not accessible to screen readers. Please switch to the table view to access the data.
Download
Source
Source
Release date
February 2017
More information
Region
United States
Survey time period
January 25 to January 28, 2017
Number of respondents
1,053 respondents
Age group
18 years and older
Method of interview
Online survey
Supplementary notes
This question was phrased by the source as follows: "We would now like to learn more about your vacation and travel preferences. Based on your vacation preferences of the last couple of years, about how often do you generally go on a鈥�"
Citation formats