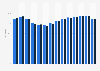
| Show - episode (air date) | Number of viewers in millions |
|---|---|
| - | - |
| - | - |
| - | - |
| - | - |
| - | - |
| - | - |
| - | - |
| - | - |
| - | - |
| - | - |
| - | - |
| - | - |
| - | - |
| - | - |
| - | - |
| - | - |
| - | - |
| - | - |
| - | - |
| - | - |
The chart is not accessible to screen readers. Please switch to the table view to access the data.
Download
Source
Sources
Release date
October 2017
More information
Region
United States
Survey time period
as of September 2017
Special properties
excluding all live broadcasts, including Super Bowls and award shows, as well as movies broadcast on TV, all of which appear prominently in Nielsen's top 100
Supplementary notes
Nielsen's viewer ratings are determined by measuring the average audience in each minute of a program as a representation of the total number of people who watched the show.
Citation formats