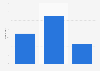
| Characteristic | Annual growth in ticket prices |
|---|---|
| - | - |
| - | - |
| - | - |
| - | - |
| - | - |
| - | - |
| - | - |
| - | - |
| - | - |
| - | - |
| - | - |
| - | - |
| - | - |
The chart is not accessible to screen readers. Please switch to the table view to access the data.
Download
Source
Sources
Release date
October 2018
More information
Region
Australia
Survey time period
2005 to 2017
Supplementary notes
Data from 24 major Australian self-ticketing venues and event promoters were used. In addition, data of the 28 members of the Australian Major Performing Arts Group (AMPAG) were provided by the Australia Council for the Arts.
Citation formats