| Characteristic | Arms imports in millions |
|---|---|
| - | - |
| - | - |
| - | - |
| - | - |
| - | - |
| - | - |
| - | - |
| - | - |
| - | - |
| - | - |
| - | - |
| - | - |
| - | - |
| - | - |
| - | - |
| - | - |
| - | - |
| - | - |
| - | - |
| - | - |
| - | - |
| - | - |
| - | - |
| - | - |
| - | - |
The chart is not accessible to screen readers. Please switch to the table view to access the data.
Download
Source
Source
Release date
March 2021
More information
Region
APAC
Survey time period
2019
Supplementary notes
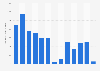
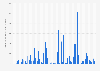
Arms transfers cover the supply of military weapons through sales, aid, gifts, and those made through manufacturing licenses. Data cover major conventional weapons such as aircraft, armored vehicles, artillery, radar systems, missiles, and ships designed for military use. Excluded are transfers of other military equipment such as small arms and light weapons, trucks, small artillery, ammunition, support equipment, technology transfers, and other services.
Figures have been rounded.
Citation formats