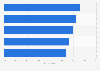
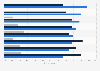
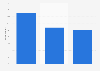
| Characteristic | Average length of meetings |
|---|---|
| - | - |
| - | - |
| - | - |
| - | - |
| - | - |
| - | - |
The chart is not accessible to screen readers. Please switch to the table view to access the data.
Download
Source
Source
Release date
September 2019
More information
Region
North America
Survey time period
between March and April 2019
Special properties
based on 132 qualified responses; respondents included travel managers, directors, vice presidents, or other corporate buyers (58 percent); meeting managers, directors, or vice presidents (27 percent); accounts payable, expense, or other corporate executives (14 percent); or travel management or meeting management company executives (one percent)
Citation formats