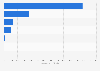
| Characteristic | Total spending in million U.S. dollars |
|---|---|
| - | - |
| - | - |
| - | - |
| - | - |
| - | - |
| - | - |
| - | - |
| - | - |
| - | - |
| - | - |
| - | - |
| - | - |
| - | - |
| - | - |
| - | - |
The chart is not accessible to screen readers. Please switch to the table view to access the data.
Download
Source
Source
Release date
July 2025
More information
Region
United States
Survey time period
Fiscal years 2012 to 2026
Supplementary notes
This statistic was assembled from several publications concerning the distribution of the U.S. national budget.
Fiscal year: October 1 to September 30.
* For several agencies, the budget requests had still to be defined by the time of publication. Thus, figures for FY 2026 are not complete.
Citation formats