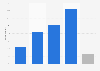
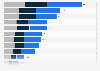
| Characteristic | Never | Less often than once a month | Once a week or two to three times a month | Once a month | Two to three times a week | Daily | Four to six times a week |
|---|---|---|---|---|---|---|---|
| - | - | - | - | - | - | - | - |
| - | - | - | - | - | - | - | - |
| - | - | - | - | - | - | - | - |
| - | - | - | - | - | - | - | - |
| - | - | - | - | - | - | - | - |
The chart is not accessible to screen readers. Please switch to the table view to access the data.
Download
Source
Source
Release date
June 2016
More information
Region
Canada
Survey time period
June 7, 2016
Age group
18 years and older
Method of interview
Telephone interview
Supplementary notes
Respondent base: 18-34: 356; 35-44: 286; 45-54: 413; 55-64: 595; 65+: 621.
This question was phrased by the source as follows: "How often did you take part in gambling, gaming activities or lotteries during the past 12 months?".
Percentage points less than or exceeding 100 percent are likely due to rounding.
Citation formats