| Characteristic | 2018 | 2019 | 2020 | 2021 |
|---|---|---|---|---|
| - | - | - | - | - |
| - | - | - | - | - |
| - | - | - | - | - |
| - | - | - | - | - |
| - | - | - | - | - |
| - | - | - | - | - |
| - | - | - | - | - |
| - | - | - | - | - |
| - | - | - | - | - |
| - | - | - | - | - |
| - | - | - | - | - |
| - | - | - | - | - |
| - | - | - | - | - |
| - | - | - | - | - |
| - | - | - | - | - |
The chart is not accessible to screen readers. Please switch to the table view to access the data.
November 2021
Germany
2018 to 2021
14 years and older
German-speaking population
Computer-assisted personal interviews (CAPI)
Main unit:
Base: German-speaking population aged 14 and over.
Total sample information:
2018: 23,086 respondents, projected to 70.45 million people
2019: 23,120 respondents, projected to 70.60 million people
2020: 23,138 respondents, projected to 70.63 million people
2021: 23,299 respondents, projected to 70.54 million people
The values shown refer to the following studies:
2018: VuMA 2019; 2019: VuMA 2020; 2020: VuMA 2021; 2021: VuMA 2022.
More information on the methodology can be found here.
Figures have been rounded for a better understanding of the statistic.
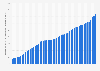
This statistic is the result of analysis, which was calculated from different characteristics of the survey. The question was not asked directly. In the survey, the participants had to indicate how often they consumed the above beers. This statistic shows for each type of beer the proportion of respondents who had the answer options "Daily", "Several times a week", "About once a week" or "Several times a month."