


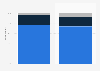

| Characteristic | Total | Mobile pohone or smartphone | Laptop | Tablet | Other mobile device |
|---|---|---|---|---|---|
| 2019 | 84.4% | 82.5% | 35% | 27.5% | 10.9% |
| 2018 | 81.7% | 79.4% | 32.5% | 26.7% | 9.1% |
| 2017 | 82.4% | 79.2% | 38.7% | 35.8% | 13.1% |
| 2016 | 73.2% | 70.5% | 22% | 21.9% | 4.5% |
| 2015 | 71.1% | 66.6% | 24.8% | 25.2% | 5.1% |
| 2014 | 65.9% | 60.4% | 23.7% | 23.3% | 4.9% |
| 2013 | 60.7% | 53.6% | 24.3% | 19.9% | 1.6% |
| 2012 | 51.4% | 40.3% | 29.2% | 16.1% | - |
The chart is not accessible to screen readers. Please switch to the table view to access the data.
Zoomable Statistic: Select the range in the chart you want to zoom in on.
Loading statistic...
Download
Source
Source
Release date
October 2019
More information
Region
Netherlands
Survey time period
2012 to 2019
Number of respondents
4,500 respondents
Age group
12 years and older
Special properties
individuals who are part of a private household
Method of interview
Computer-assisted telephone interviews (CATI)
Supplementary notes
* Original survey question: "In the past three months, have you used mobile internet at home or at work on one of the following devices: - Mobile phone or smartphone? - Laptop or netbook? - Tablet? - Other device?"
Multiple answers were possible.
Citation formats



