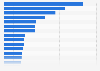
| Characteristic | Share of respondents |
|---|---|
| - | - |
| - | - |
| - | - |
| - | - |
| - | - |
| - | - |
| - | - |
| - | - |
| - | - |
| - | - |
| - | - |
| - | - |
| - | - |
| - | - |
| - | - |
| - | - |
| - | - |
| - | - |
| - | - |
| - | - |
| - | - |
| - | - |
| - | - |
| - | - |
| - | - |
| - | - |
| - | - |
| - | - |
| - | - |
| - | - |
| - | - |
| - | - |
| - | - |
| - | - |
| - | - |
| - | - |
| - | - |
| - | - |
| - | - |
| - | - |
| - | - |
| - | - |
| - | - |
| - | - |
| - | - |
| - | - |
| - | - |
| - | - |
| - | - |
| - | - |
| - | - |
| - | - |
The chart is not accessible to screen readers. Please switch to the table view to access the data.
Download
Source
Sources
Release date
January 2015
More information
Region
United States
Survey time period
November 2014
Number of respondents
812*
Age group
13-49
Special properties
* female respondents only
Method of interview
Face-to-face interview
Supplementary notes
The source phrases the question as follows: "Please think about being happy. Think about how it feels to be happy and what things make you happy. Now, please define and describe as completely as you can what being happy means to you."
Results below 1 percent not being displayed.
Percentage points exceeding 100 percent are due to the open-ended nature of the original question's responses given.
Citation formats