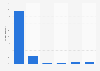
| Characteristic | Got worse | Stayed the same | Improved |
|---|---|---|---|
| - | - | - | - |
| - | - | - | - |
| - | - | - | - |
| - | - | - | - |
| - | - | - | - |
| - | - | - | - |
| - | - | - | - |
| - | - | - | - |
| - | - | - | - |
| - | - | - | - |
| - | - | - | - |
| - | - | - | - |
| - | - | - | - |
| - | - | - | - |
The chart is not accessible to screen readers. Please switch to the table view to access the data.
Download
Source
Source
Release date
May 2019
More information
Region
United Kingdom
Survey time period
2005 to 2018
Number of respondents
2,313 respondents
Age group
16 years and older
Special properties
all with any TV sets*
Method of interview
Computer-assisted personal interviews (CAPI)
Supplementary notes
* Prior to 2014: all with TV but excl. those never watching.
Original survey question: "Do you feel that over the past year television programmes have improved, got worse or stayed about the same?"
Citation formats