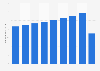
| Characteristic | 2020 | 2019 |
|---|---|---|
| - | - | - |
| - | - | - |
| - | - | - |
| - | - | - |
| - | - | - |
| - | - | - |
| - | - | - |
| - | - | - |
| - | - | - |
| - | - | - |
The chart is not accessible to screen readers. Please switch to the table view to access the data.
Download
Source
Source
Release date
May 2022
More information
Region
Worldwide
Survey time period
2019 and 2020
Supplementary notes
* The ridership figures for Tokyo are the aggregation of the networks of different
operators, including the largest ones, Tokyo Metro and TOEI. This means that an
unknown number of trips using lines of multiple operators are counted twice.
** Delhi data is for the financial year (April to March); 2020 data is an estimation, as official data was not available.
Citation formats