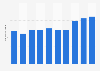
| Characteristic | Consolidated production in million euros |
|---|---|
| - | - |
| - | - |
| - | - |
| - | - |
| - | - |
| - | - |
| - | - |
| - | - |
| - | - |
| - | - |
| - | - |
| - | - |
| - | - |
| - | - |
| - | - |
| - | - |
| - | - |
| - | - |
| - | - |
| - | - |
| - | - |
| - | - |
| - | - |
| - | - |
| - | - |
| - | - |
| - | - |
| - | - |
| - | - |
| - | - |
| - | - |
| - | - |
| - | - |
The chart is not accessible to screen readers. Please switch to the table view to access the data.
Download
Source
Source
Release date
November 2016
More information
Region
Netherlands
Survey time period
2014
Supplementary notes
The source defines consolidated producation as: "The production less the internal deliveries."
The official SN calculations use an ex ante interest rate based on the internal reference rate of banks and a risk premium for calculating capital services. The model allows for profits to be made as opposed to the neoclassical model.
* The figures for 2014 are provisional.
Citation formats