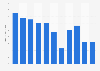
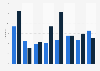
| Characteristic | Flemish Region | Brussels-Capital Region | Walloon Region |
|---|---|---|---|
| 2008 | 8.6% | 19.9% | 15.2% |
| 2009 | 8.6% | 15.6% | 13.8% |
| 2010 | 9.6% | 18.4% | 13.7% |
| 2011 | 9.6% | 18.9% | 14.7% |
| 2012 | 8.7% | 20.1% | 14.8% |
| 2013 | 7.5% | 17.7% | 14.7% |
| 2014* | 7% | 14.4% | 12.9% |
| 2015 | 7.2% | 15.8% | 13.1% |
| 2016 | 6.8% | 14.8% | 10.3% |
| 2017 | 7.2% | 12.9% | 10.5% |
| 2018 | 7.3% | 10.7% | 9.9% |
| 2019 | 6.2% | 11.8% | 10.9% |
| 2020 | 6.7% | 9.7% | 9.8% |
| 2021 | 5.3% | 9.1% | 8.3% |
| 2022 | 4.9% | 7.4% | 8.6% |
The chart is not accessible to screen readers. Please switch to the table view to access the data.
Loading statistic...
Download
Source
Source
Release date
March 2023
More information
Region
Belgium
Survey time period
2008 to 2022
Supplementary notes
Statistics Belgium defines a dropout as someone aged between 18 and 24 who does not have a secondary school degree and is not attending any form of educational training at the moment.
* Because of changes in methods, questioning and variables, the figure for 2014 is not entirely comparable to the other figures.
Belgium is divided into 3 regions: the Flemish Region, the Brussels-Capital Region and the Walloon Region. Each region has its own Regional Parliament and a Regional Government.
Citation formats