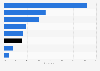
| Days relative to hotel booking | Share of flight bookings |
|---|---|
| 91-180 days before | 2.6% |
| 61-90 days before | 2.4% |
| 31-60 days before | 4.8% |
| 15-30 days before | 5.3% |
| 8-14 days before | 4.5% |
| 4-7 days before | 5.1% |
| 1-3 days before | 9.9% |
| Same day | 46.4% |
| 1-3 days after | 5.1% |
| 4-7 days after | 2.9% |
| 8-14 days after | 2.9% |
| 15-30 days after | 3.4% |
| 31-60 days after | 2.7% |
| 61-90 days after | 1% |
| 91-180 days after | 0.8% |
The chart is not accessible to screen readers. Please switch to the table view to access the data.
Loading statistic...
Download
Source
Source
Release date
November 2015
More information
Region
Worldwide
Survey time period
as of November 2015
Supplementary notes
Sojern鈥檚 insights reports are based on the rigorous analysis of more than a billion traveler intent data points, obtained through Sojern鈥檚 unique partnerships with some of the world鈥檚 most renowned travel brands. Our analysis is based on airport level data which are then aggregated to countries and regions. All of the insights are based on very specific data sets as provided by Sojern's data partners.
Citation formats