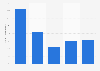
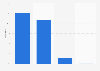
| Characteristic | Unmarried | Married | Widow(er) | Divorced |
|---|---|---|---|---|
| 2019 | 126,487 | 27,929 | 946 | 5,667 |
| 2018 | 122,314 | 28,081 | 905 | 6,066 |
| 2017 | 118,789 | 28,308 | 900 | 6,295 |
| 2016 | 114,975 | 29,104 | 943 | 6,523 |
| 2015 | 111,619 | 29,691 | 994 | 7,205 |
| 2014 | 108,954 | 30,703 | 966 | 7,239 |
| 2013 | 108,671 | 29,355 | 894 | 6,749 |
| 2012 | 107,083 | 29,449 | 860 | 7,099 |
| 2011 | 97,203 | 28,502 | 895 | 6,594 |
| 2010 | 86,439 | 27,744 | 778 | 6,390 |
| 2009 | 78,691 | 26,149 | 776 | 6,281 |
The chart is not accessible to screen readers. Please switch to the table view to access the data.
June 2020
Netherlands
2009 to 2019
Emigration including administrative corrections. The total of the administrative corrections is the sum of the administrative inclusions minus the administrative removals.
Administrative inclusion means that a person is included in the municipality administration at his/her own request. This is not the result of a birth, immigration or relocation to another municipality, and is usually the case with people who have been administratively removed even though they had never left the country. Administrative removal means that persons are removed from the municipality bookkeeping because the municipality cannot reach the person, has no information regarding his/her whereabouts and this person is no longer living in this municipality. This is usually the case with people leaving the country without informing the municipality.