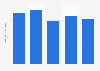
| Characteristic | Operating income or loss in million U.S. dollars |
|---|---|
| - | - |
| - | - |
| - | - |
| - | - |
| - | - |
| - | - |
| - | - |
| - | - |
| - | - |
| - | - |
| - | - |
| - | - |
The chart is not accessible to screen readers. Please switch to the table view to access the data.
Download
Source
Source
Release date
July 2022
More information
Region
Worldwide
Survey time period
FY 2011 to FY 2022
Supplementary notes
Some figures include impairment and related charges, realignment costs, as well as mark-to-market losses.
The fiscal year ends May 31.
Figures through 2020 were taken from previous editions.
Figures from 2015 onwards only include the service cost component in the 鈥淪alaries and employee benefits鈥� line item, as required by the new pension guidance adopted in FY 2019.
Citation formats