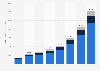
| Characteristic | Number of visits in millions |
|---|---|
| - | - |
| - | - |
| - | - |
| - | - |
| - | - |
| - | - |
| - | - |
| - | - |
| - | - |
| - | - |
| - | - |
| - | - |
| - | - |
| - | - |
| - | - |
| - | - |
| - | - |
| - | - |
| - | - |
| - | - |
| - | - |
| - | - |
The chart is not accessible to screen readers. Please switch to the table view to access the data.
Download
Source
Source
Release date
November 2020
More information
Region
United Kingdom
Survey time period
Q1 2015 to Q2 2020
Supplementary notes
*The source specifies that the International Passenger Survey (IPS) was suspended on March 16, 2020 due to the coronavirus (COVID-19) pandemic. As of November 9, 2020, interviewing had not yet resumed. Thus, figures from April to June 2020 are based on administrative sources and modelling since no data was collected during this period. Figures for the second quarter of 2020 are provisional and non-seasonally adjusted.
Figures have been rounded.
Citation formats