

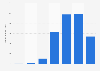


| Characteristic | Share of respondents |
|---|---|
| Zero to 1,000 U.S. dollars | 55% |
| 1,001 to 10,000 U.S. dollars | 14% |
| 10,000 to 100,000 U.S. dollars | 8% |
| 100,000 to 500,000 U.S. dollars | 3% |
| 500,000 U.S. dollars and more | 1% |
| Prefer not to answer | 18% |
The chart is not accessible to screen readers. Please switch to the table view to access the data.
Loading statistic...
Download
Source
Source
In cooperation with
InMobi
Release date
February 2016
More information
Region
Worldwide
Survey time period
September and November 2015
Number of respondents
global n=1,085; base n = 900
Age group
15 years and older
Special properties
app developers and publishers
Method of interview
Online survey
Supplementary notes
Original question: How much revenue per month do you generate from mobile apps on your primary platform and all other platforms combined (on average, in U.S. dollars)?
Revenue numbers exclude China, Japan and Korea markets.
Citation formats



