| Characteristic | Share of respondents |
|---|---|
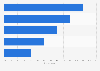
| Day trip | 88% |
| Weekend getaway | 84% |
| Multi-day vacation in U.S. | 84% |
| Theme park | 82% |
| Trip to see relatives | 82% |
| Museum or cultural attraction | 82% |
| City vacation | 82% |
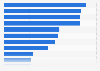
| Beach vacation | 77% |
| Family road trip | 76% |
| Attending sport events | 59% |
| Visits to a national park | 52% |
| Camping trip | 49% |
| Family reunion | 42% |
| Competing in sports events | 32% |
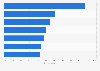
| Safari or wildlife viewing | 25% |
| Multi-day vacation international | 24% |
| Cruise | 20% |
| Ski or snowboard | 15% |
| RV trip | 13% |
| Volunteer or mission trip | 10% |
The chart is not accessible to screen readers. Please switch to the table view to access the data.
Loading statistic...
Download
Source
Source
Release date
October 2016
More information
Region
United States
Survey time period
April to August, 2016
Age group
18 years and older
Special properties
have at least one child who is 17聽years of age or younger*
Method of interview
Face-to-face interview
Supplementary notes
* The source does not provide detailed information regarding the number of respondents or the questions. The chosen wording here might therefore differ slightly from the survey.
Multiple answers were possible.
Citation formats